Among the many utterly ridiculous claims made by the Texas GOP and “energy” industry, is that they couldn’t have foreseen a “Black Swan” event like the winter storms in Texas (because the 2011 Super Bowl Storm, https://www.nytimes.com/2011/02/05/us/05storm.html, was so long ago) and it would have been too expensive to weatherize the infrastructure–natural gas, coal, nuclear, and oil (because wind, the scapegoat for Texas politicos right now makes up barely 10 percent of the power grid and wind turbines can work perfectly fine in cold weather, as in Antarctica and Alaska).

So below is some data on just how much the major energy companies in Texas raked in. I guess when you’re making $9-12 billion a year, you can’t afford to plan for a rain, or snowy, day. Maybe a GoFundMe page is in order?
NRG Energy annual/quarterly revenue history and growth rate from 2006 to 2020. Revenue can be defined as the amount of money a company receives from its customers in exchange for the sales of goods or services. Revenue is the top line item on an income statement from which all costs and expenses are subtracted to arrive at net income.
- NRG Energy revenue for the quarter ending September 30, 2020 was $2.809B, a 6.24% decline year-over-year.
- NRG Energy revenue for the twelve months ending September 30, 2020 was $9.261B, a 3.71% decline year-over-year.
- NRG Energy annual revenue for 2019 was $9.821B, a 3.62% increase from 2018.
- NRG Energy annual revenue for 2018 was $9.478B, a 4.45% increase from 2017.
- NRG Energy annual revenue for 2017 was $9.074B, a 1.78% increase from 2016. ****************************
CenterPoint Energy Revenue, 2006-2020
CenterPoint Energy annual/quarterly revenue history and growth rate from 2006 to 2020. Revenue can be defined as the amount of money a company receives from its customers in exchange for the sales of goods or services. Revenue is the top line item on an income statement from which all costs and expenses are subtracted to arrive at net income.
- CenterPoint Energy revenue for the quarter ending September 30, 2020 was $1.622B, a 2.17% decline year-over-year.
- CenterPoint Energy revenue for the twelve months ending September 30, 2020 was $12.120B, a 41.24% increase year-over-year.
- CenterPoint Energy annual revenue for 2019 was $12.301B, a 16.17% increase from 2018.
- CenterPoint Energy annual revenue for 2018 was $10.589B, a 10.14% increase from 2017.
- CenterPoint Energy annual revenue for 2017 was $9.614B, a 27.71% increase from 2016. *******************
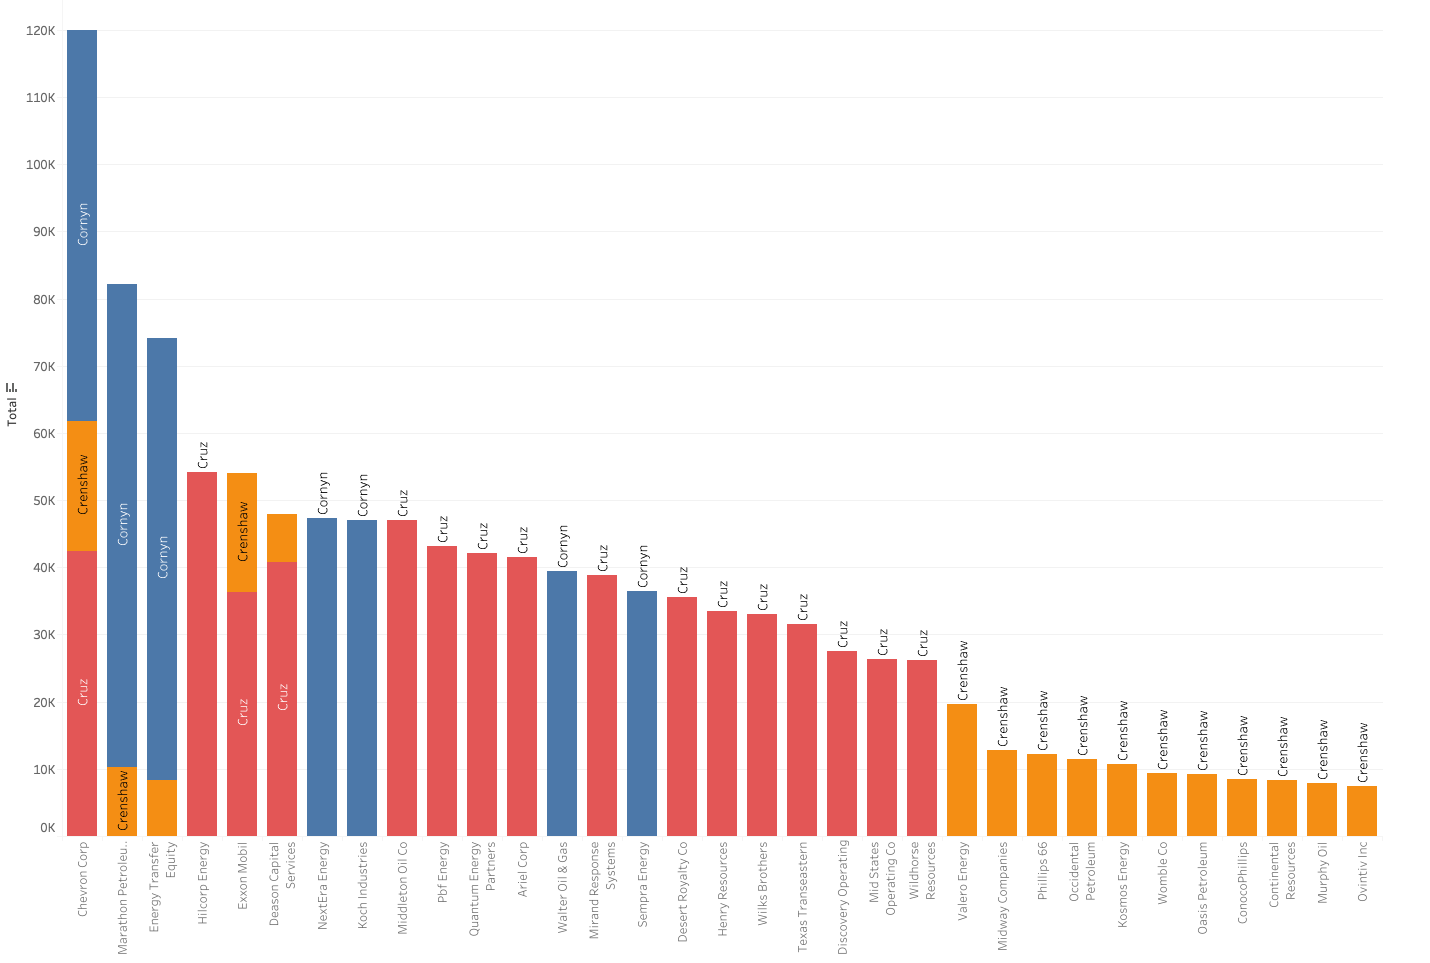
Top Recipients of Oil and Gas Donations (from Open Secrets)
2020: Top recipients were Trump and Biden. After that, #1 was Cornyn, @ $1million
In House, top 2 were McCarthy and Scalise—GOP leaders. After that it was Pfluger, Crenshaw, and Hunt, all Texas GOP
2018: Top recipient was Cruz, second was Beto O’Rourke, just a little lower was Cornyn (not even on ballot that year)
In House, top 10 included Hurd, Brady, Culberson, Sessions-all Texas GOP
2016: Cruz was top recipient with $1.7 million (more than Trump and Clinton)
2020 Vote: Counties with oil/coal industry voted 65% Trump; without oil/coal voted 45% Trump

Pingback: Texas Energy Corporations make billions, but weatherization was too expensive….. – Green and Red Podcast
Pingback: Texas Freezes Over: Cowboy Capitalism, Big Oil’s Spin Machine and Mutual Aid – Rising Tide North America
Pingback: Cowboy Capitalism, Big Oil’s Spin Machine and Mutual Aid – Green and Red Podcast